starting the course
An introductory activity designed to recall prior knowledge (e.g. trig functions) while getting at one of the big ideas of calculus: that the derivative operator is similar to a function because it takes in an input (in this case, a graph) and spits out an output (in this case, another graph) based on a simple rule. For more information, and materials, click here! It is a long activity and will likely take multiple days.
limits
Here is a 7:00 short film that actually gets interesting around the 3:00 mark. It is useful for understanding discontinuous functions. When someone goes through a portal, they enter and exit with the same velocity. However their position is discontinuous -- they enter at one position and leave at another. So although the velocity graph should be continuous, the position graph is not.
Try having student graph her position as she moves down the hallway around the 4:00 mark or vertical position as she enters the stairway on the next scene or horizontal position as she jumps off the roof. (David)
derivatives
Students perform a "lollipop lab" which draws together delicious candy, average and instantaneous rates of change, and tied in to those ideas, first differences and first derivatives. Download the lab here.
A simple fold on a piece of paper brings up a fascinating calculus optimization problem: how do you maximize the area of a triangle formed by this fold? Students first get a hands-on and concrete experience with the problem by actually folding different size papers in different ways and measure the areas of the triangles. Then students apply calculus to the problem to see the power that calculus bears on the situation. Importantly, the derivative that students have to take requires the product rule, which arises naturally. (We have found it hard to find situations which generate functions where the product rule is natural.) The "playing" with the triangle is here, and the calculus part is here.
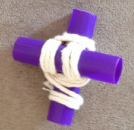
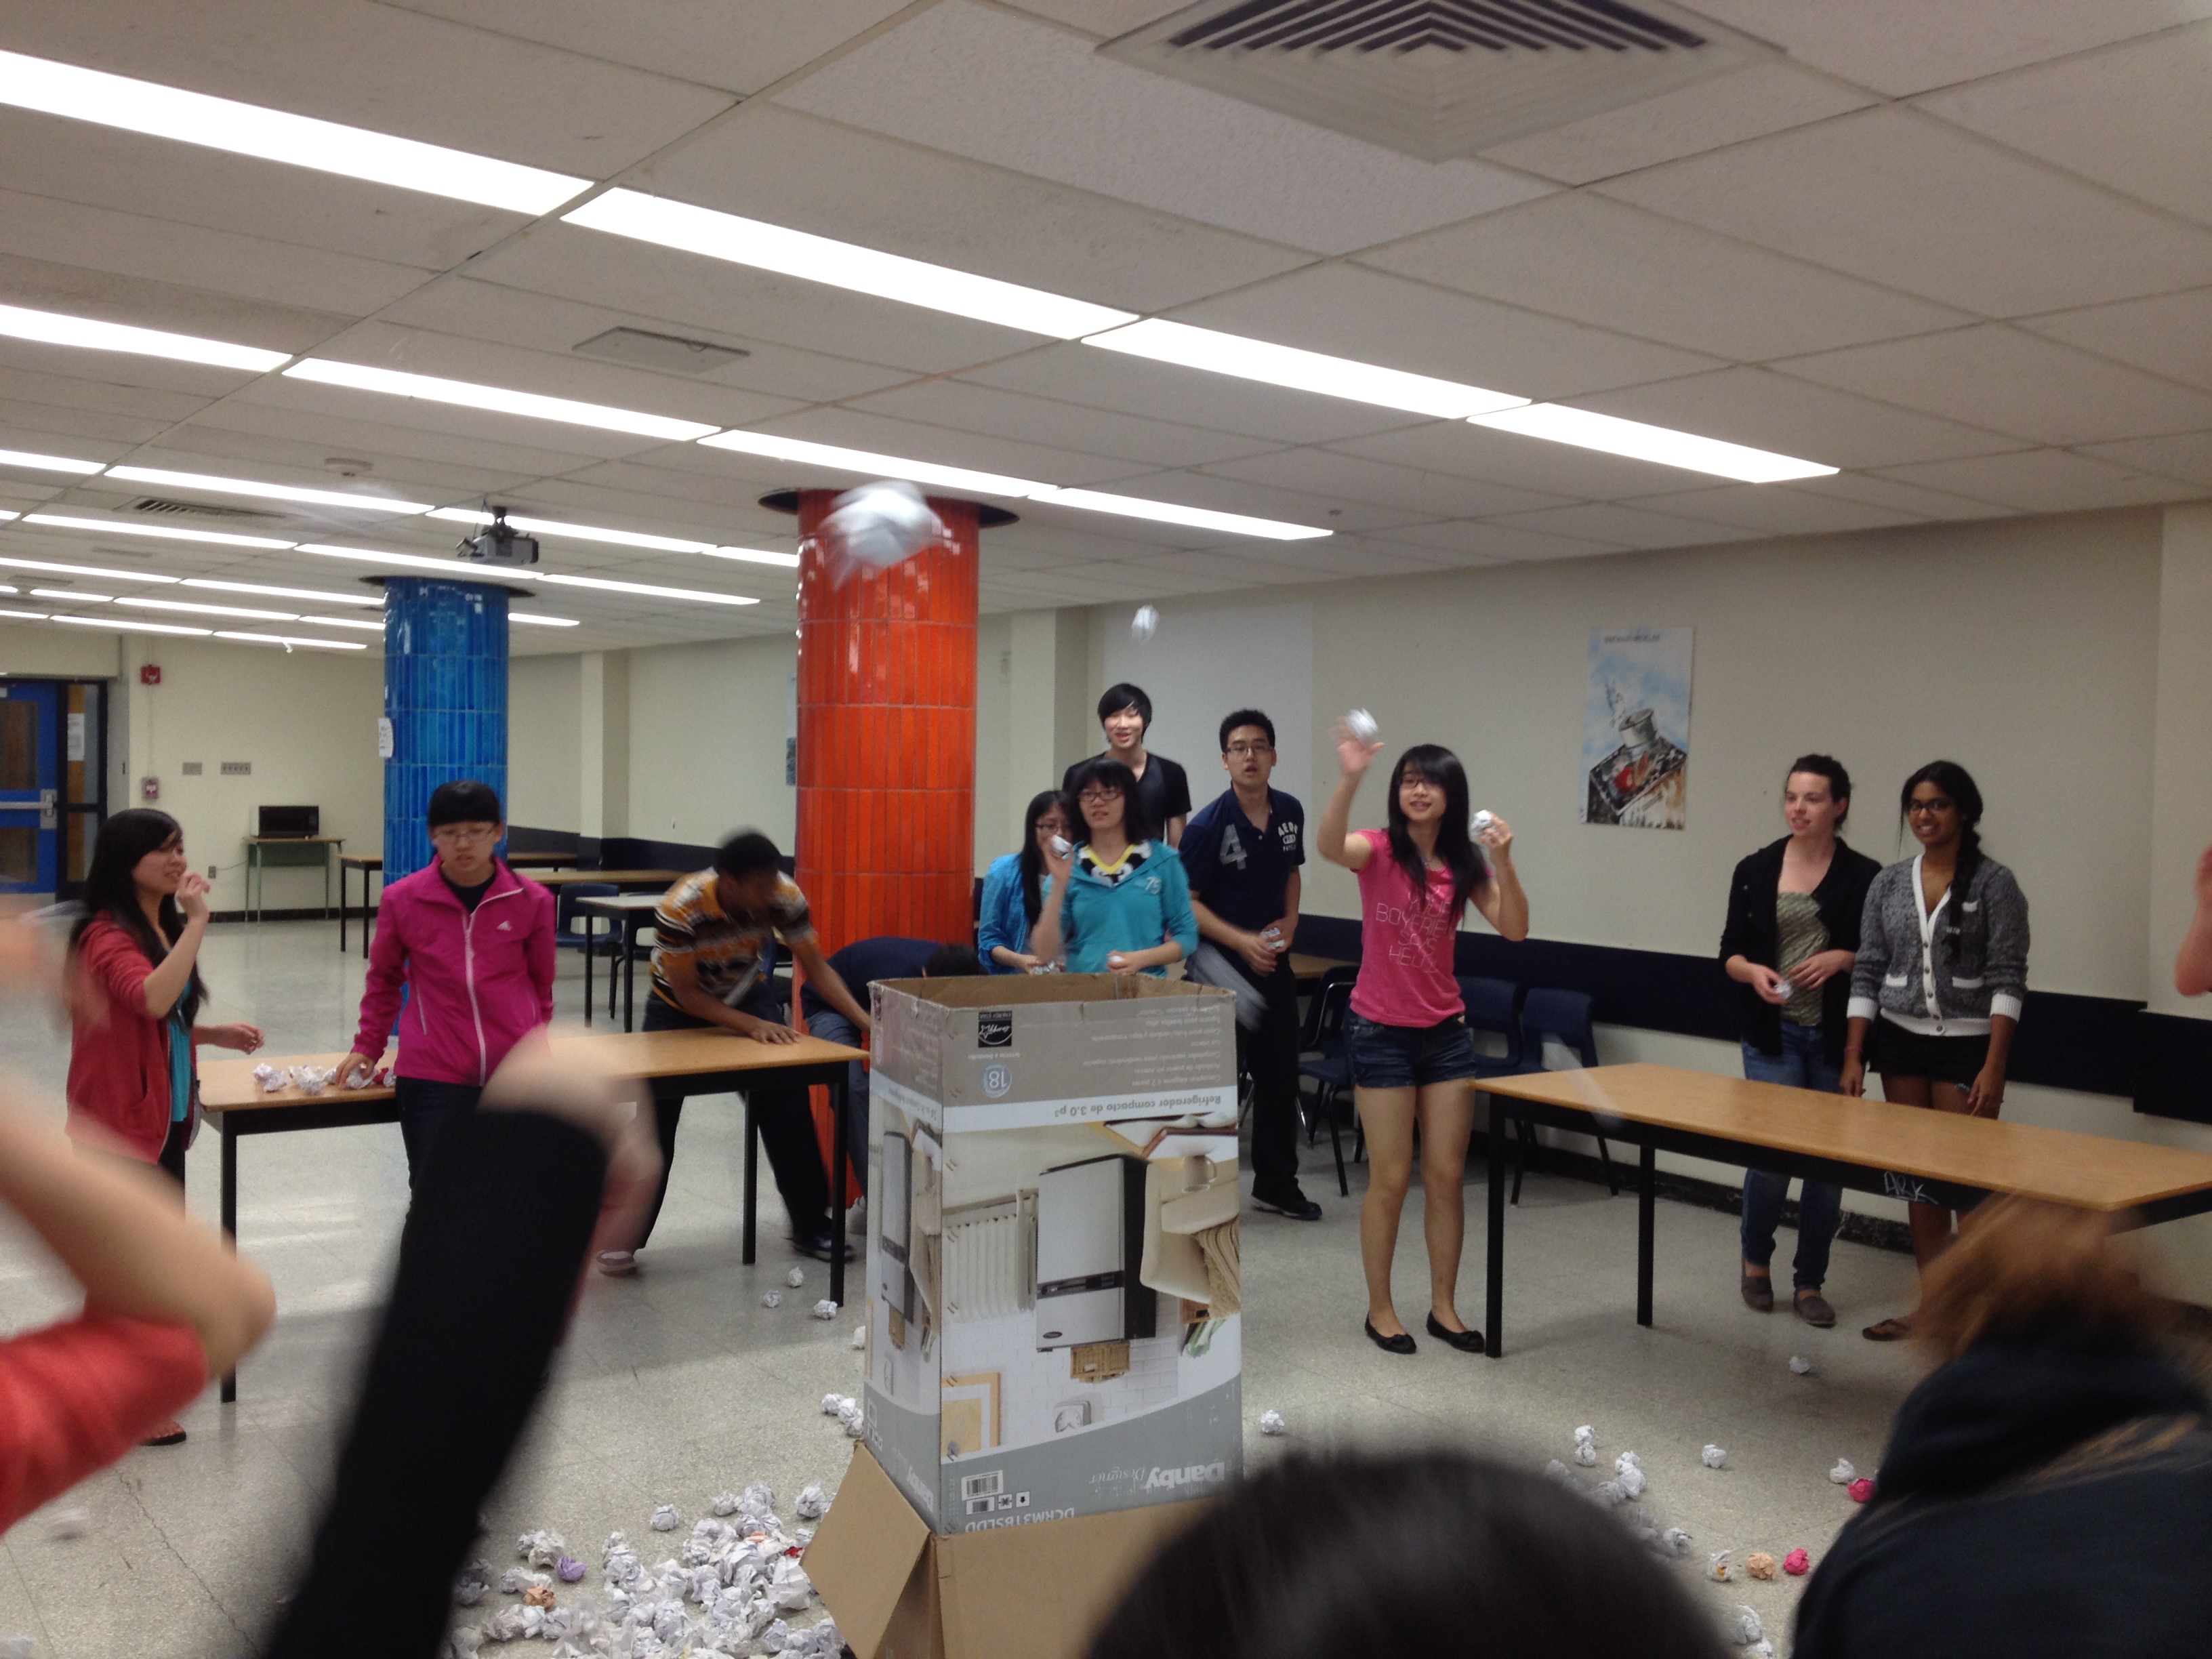
Do you want kids to have a concrete understanding of related rates, and test their hand-eye coordination skills? Have them throw paper balls at a specific container and see how fast or slow the volume of the balls in the container are changing. A picture of this activity is here, a video of this activity is here, and the worksheet for the activity is here.
Chain Rule. Here's a worksheet to see if students can apply it where at least one of the functions is not defined explicitly. This skill -- being able to differentiate when one function is not defined explicitly -- has been appearing more and more on the AP exams.
Does f'(x)=0 or f'(x) dne always guarantee a relative extrema? Never? Sometimes? Have your students ponder and explain the First Derivative Test to an adult. The take-home assignment is here.
Explore the First and Second Derivative Tests with technology (both with graphs and with tables). Students are led through multiple examples and are asked to record their observations. Click here for Version 1 (more specific questions) and here for Version 2 (more generic questions).
Here is a gradient on graph paper that is very useful when sketching derivatives (or integrals)-- especially when the exact y-coordinates are not important. For visual students, imagine having a derivative sketched on the gradient paper. They then can understand the darker the green, the steeper (positively) the original function is. And the darker the red, the steeper (negatively) the original function is. And the lighter colors (close to white) mean the original function is pretty horizontal. You can use this to compare steepness of slopes without exact y-values -- by simply asking "is it lighter or darker?" (David)
A simple fold on a piece of paper brings up a fascinating calculus optimization problem: how do you maximize the area of a triangle formed by this fold? Students first get a hands-on and concrete experience with the problem by actually folding different size papers in different ways and measure the areas of the triangles. Then students apply calculus to the problem to see the power that calculus bears on the situation. Importantly, the derivative that students have to take requires the product rule, which arises naturally. (We have found it hard to find situations which generate functions where the product rule is natural.) The "playing" with the triangle is here, and the calculus part is here.
Do you want kids to have a concrete understanding of related rates, and test their hand-eye coordination skills? Have them throw paper balls at a specific container and see how fast or slow the volume of the balls in the container are changing. A picture of this activity is here, a video of this activity is here, and the worksheet for the activity is here.
Chain Rule. Here's a worksheet to see if students can apply it where at least one of the functions is not defined explicitly. This skill -- being able to differentiate when one function is not defined explicitly -- has been appearing more and more on the AP exams.
Does f'(x)=0 or f'(x) dne always guarantee a relative extrema? Never? Sometimes? Have your students ponder and explain the First Derivative Test to an adult. The take-home assignment is here.
Explore the First and Second Derivative Tests with technology (both with graphs and with tables). Students are led through multiple examples and are asked to record their observations. Click here for Version 1 (more specific questions) and here for Version 2 (more generic questions).
Here is a gradient on graph paper that is very useful when sketching derivatives (or integrals)-- especially when the exact y-coordinates are not important. For visual students, imagine having a derivative sketched on the gradient paper. They then can understand the darker the green, the steeper (positively) the original function is. And the darker the red, the steeper (negatively) the original function is. And the lighter colors (close to white) mean the original function is pretty horizontal. You can use this to compare steepness of slopes without exact y-values -- by simply asking "is it lighter or darker?" (David)
integrals
Students often learn the algorithmic side to u-substitution. But wouldn't it be nice to show them the visual transformation of space that accompanies this simple algebraic technique? Here are five geogebra applets (but no additional resources on how to use them yet) which give some visual understanding to what u-substitution is doing to the graphs/signed-areas. Click for applets 1, 2, 3, 4, and 5.
This Volume Project asks students to create their own 3D solids from past AP Free Response Questions. Click here for the rubric and directions.
This Volume Project asks students to create their own 3D solids from past AP Free Response Questions. Click here for the rubric and directions.
differential eqns, series, Parametric and Polar, and other stuff
Do you want a hands-on activity that emphasizes what parametric equations really are, and how they work? This activity, using simple materials, emphasizes that the x- and y-coordinates of parametric equations are really unrelated to each other. Here is the write up of the lesson plan, and a link to the worksheet for parametric equations. The inspiration for this was a geogebra file illustrating the big idea in parametric graphing (here). In this geogebra file, you should be able to just redefine f(x) and g(x) to change the parametric functions. (David)
